Quality Analysis & Statistics
MPDV Mikrolab GmbH
Quality Analysis & Statistics
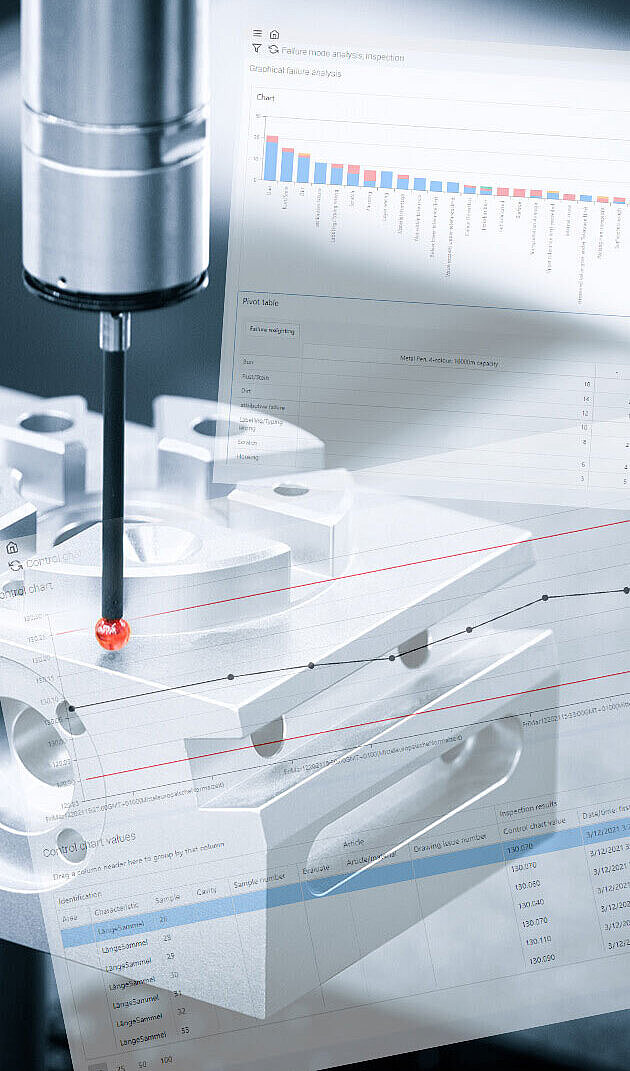
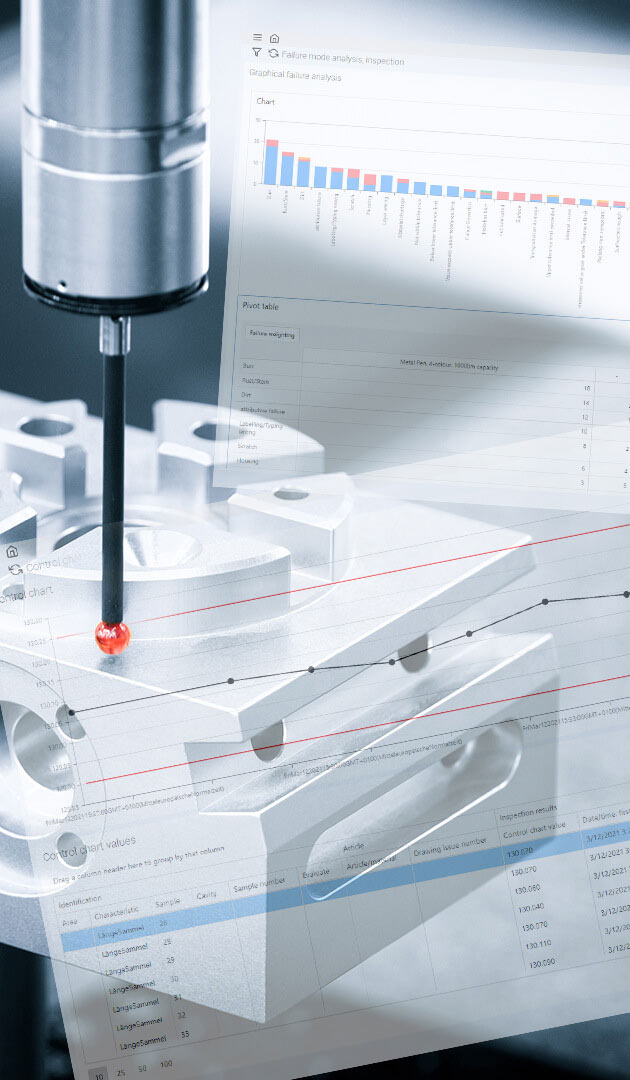
It pays off to prepare quality data graphically to better understand it. The mApp Quality Analysis & Statistics provides applications to display and analyze inspection results in form of control charts and histograms. The mApp also calculates statistical KPIs such as Cp and Cpk.
You decide which criteria you want to use to evaluate your inspection data — e.g. by orders or articles. To do so, you can also display several control charts in parallel.
Optional functions
- Evaluate inspection processes and calculate organizational KPIs.
- Transfer recorded quality data to qs-STAT for further processing.
Your benefits
You keep an eye on all quality data and can analyze exactly where and how your manufacturing processes can be improved, if required.
Technical information
The mApp Quality Analysis & Statistics is part of the Quality Management category of HYDRA X.
The mApp uses data of the Virtual Production Reality (ViPR) of MPDV's Manufacturing Integration Platform (MIP).
Quality Analysis & Statistics in the MIP ecosystem
The mApp evaluates quality data recorded during inspections in production and incoming good inspections. MPDV also offers the following mApps for this purpose:
- In-Production Inspection: conduct in-production inspections.
- Incoming Goods Inspection: perform incoming goods inspections.
- Quality Analysis & Statistics: evaluate and analyze inspection data.
- Complaint Management: process complaints efficiently.
#quality #integration #smartfactory #analytics #hydra